Multi-TF
Multi-Timeframe Replay
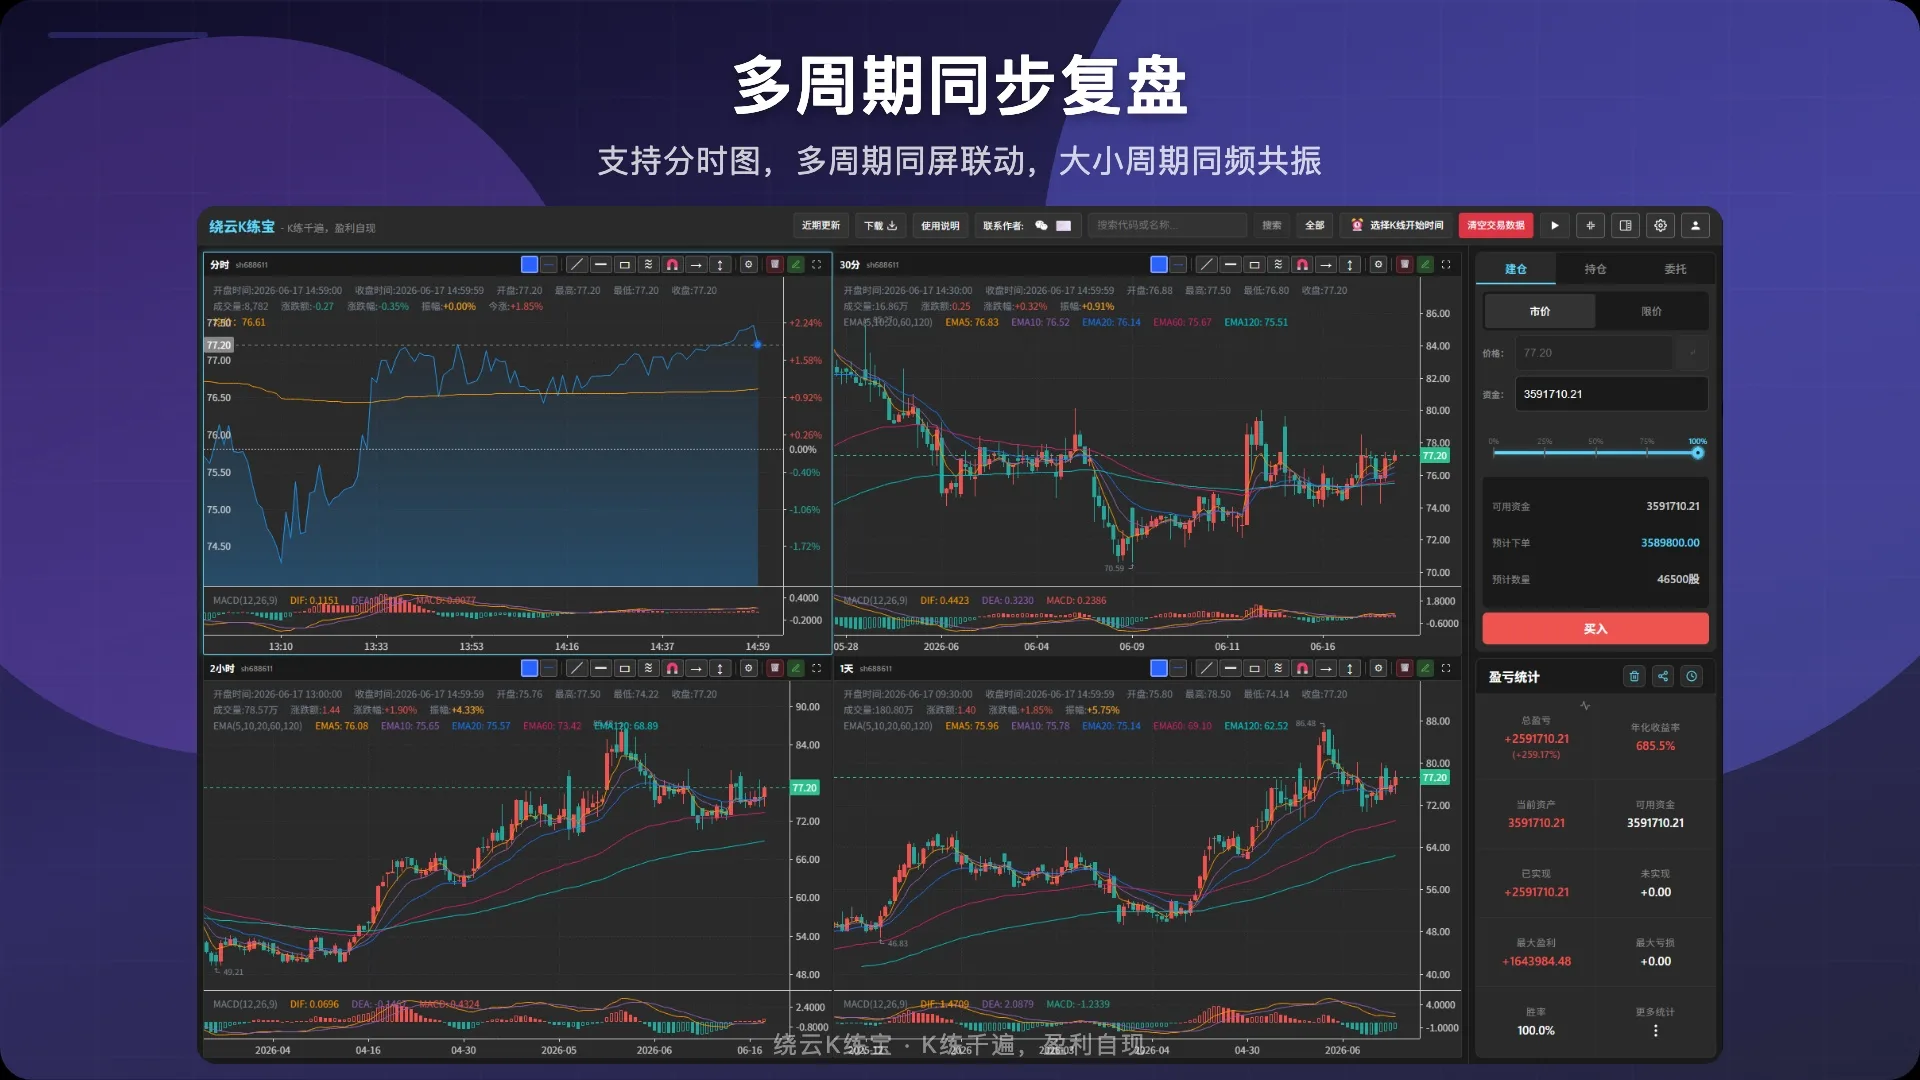
Show up to 4 timeframe charts at once with fully synchronized time axes. Click any chart to make it the master, then step through with arrow keys — multi-timeframe confluence at a glance.
iTradeTrainer is a professional K-line replay and trading simulation tool. Replay ~20 years of historical markets, analyze multiple timeframes in sync, and place simulated orders — sharpening your trading system at zero capital risk.
This tool is for K-line learning and replay practice only. It provides no investment advice and involves no real money.
Real-money tuition is expensive, and instinct takes thousands of repetitions
Markets trade only a few hours a day. In a whole year you observe limited price action, so experience builds painfully slowly.
Practicing entries, exits and stop-losses with real money means every mistake is a real loss.
Trading instinct needs thousands of repetitions. Live markets simply cannot give you enough samples.
A complete replay-training toolchain, from market playback to performance analytics
Show up to 4 timeframe charts at once with fully synchronized time axes. Click any chart to make it the master, then step through with arrow keys — multi-timeframe confluence at a glance.
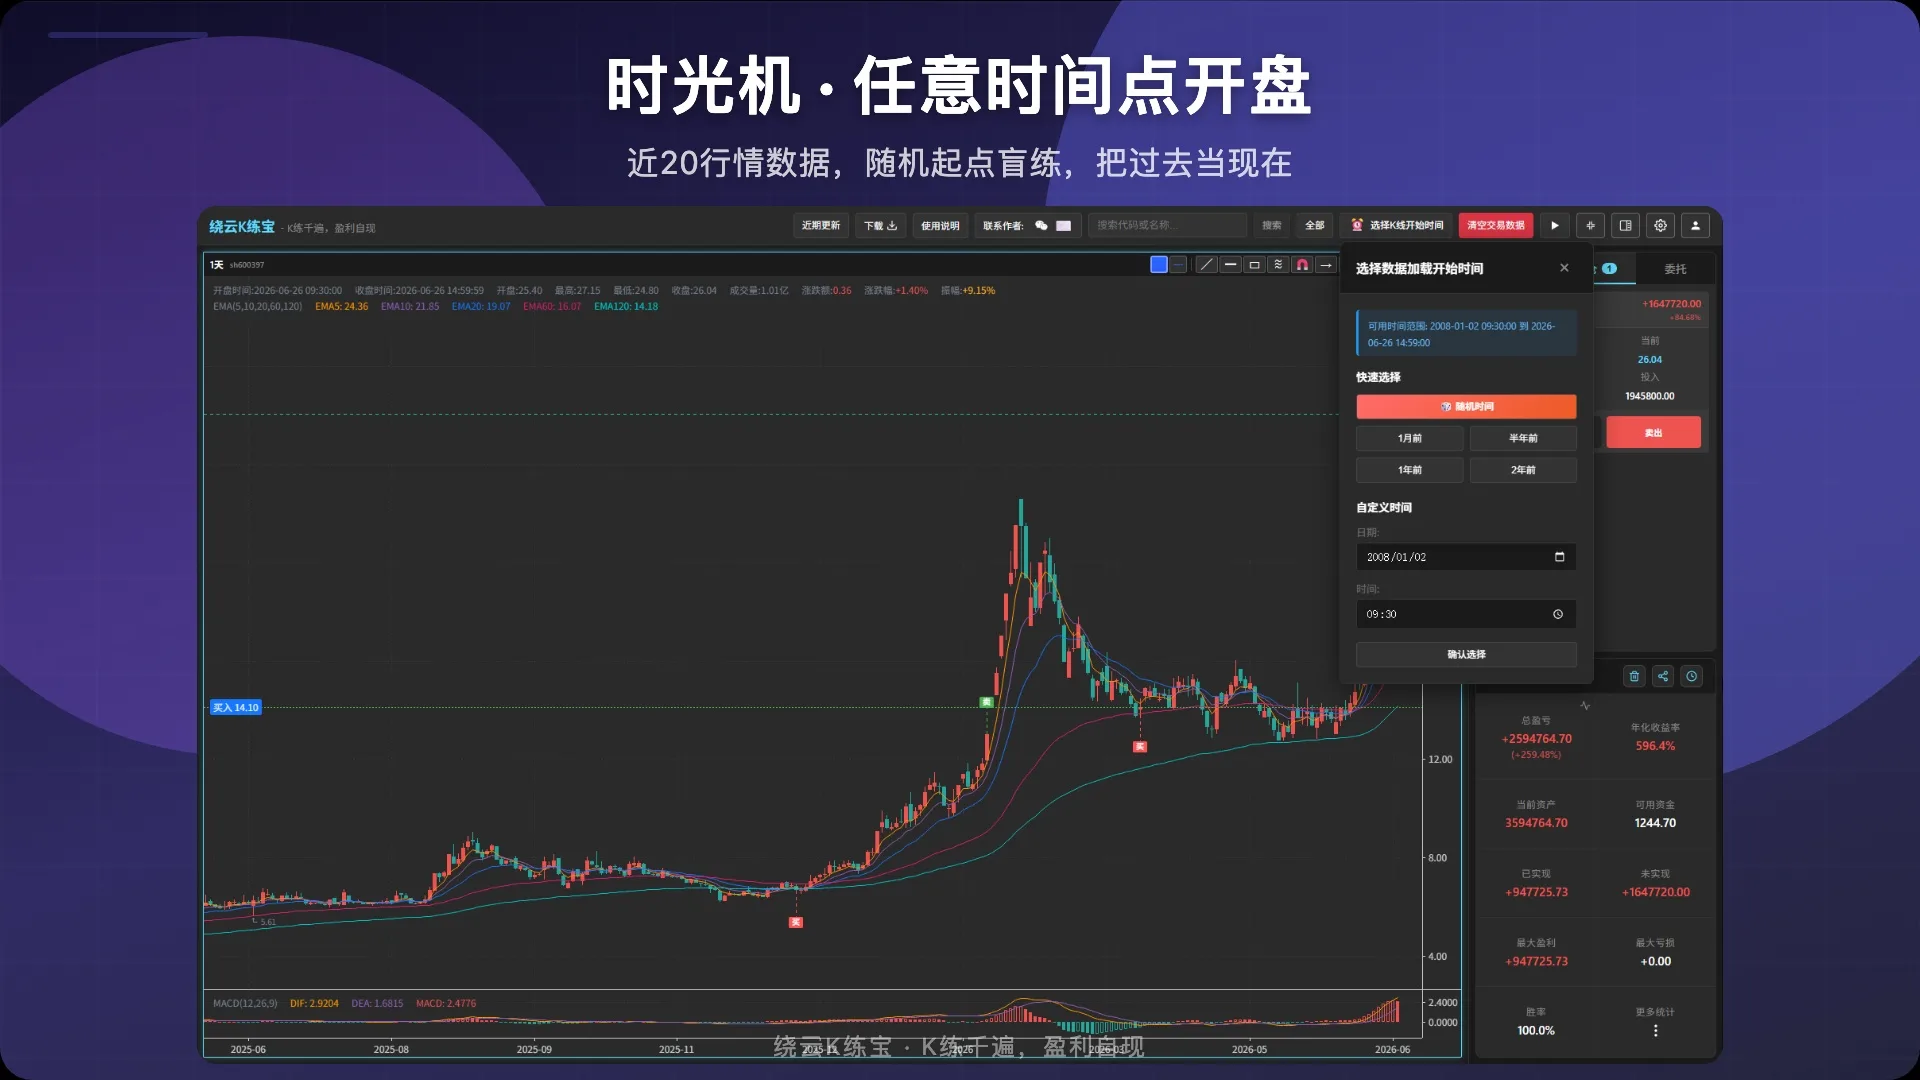
Treat any historical moment as "now". Step forward/back bar by bar, or auto-play (0.1×–5×). Replay ~20 years of history any time to test your read of what comes next.
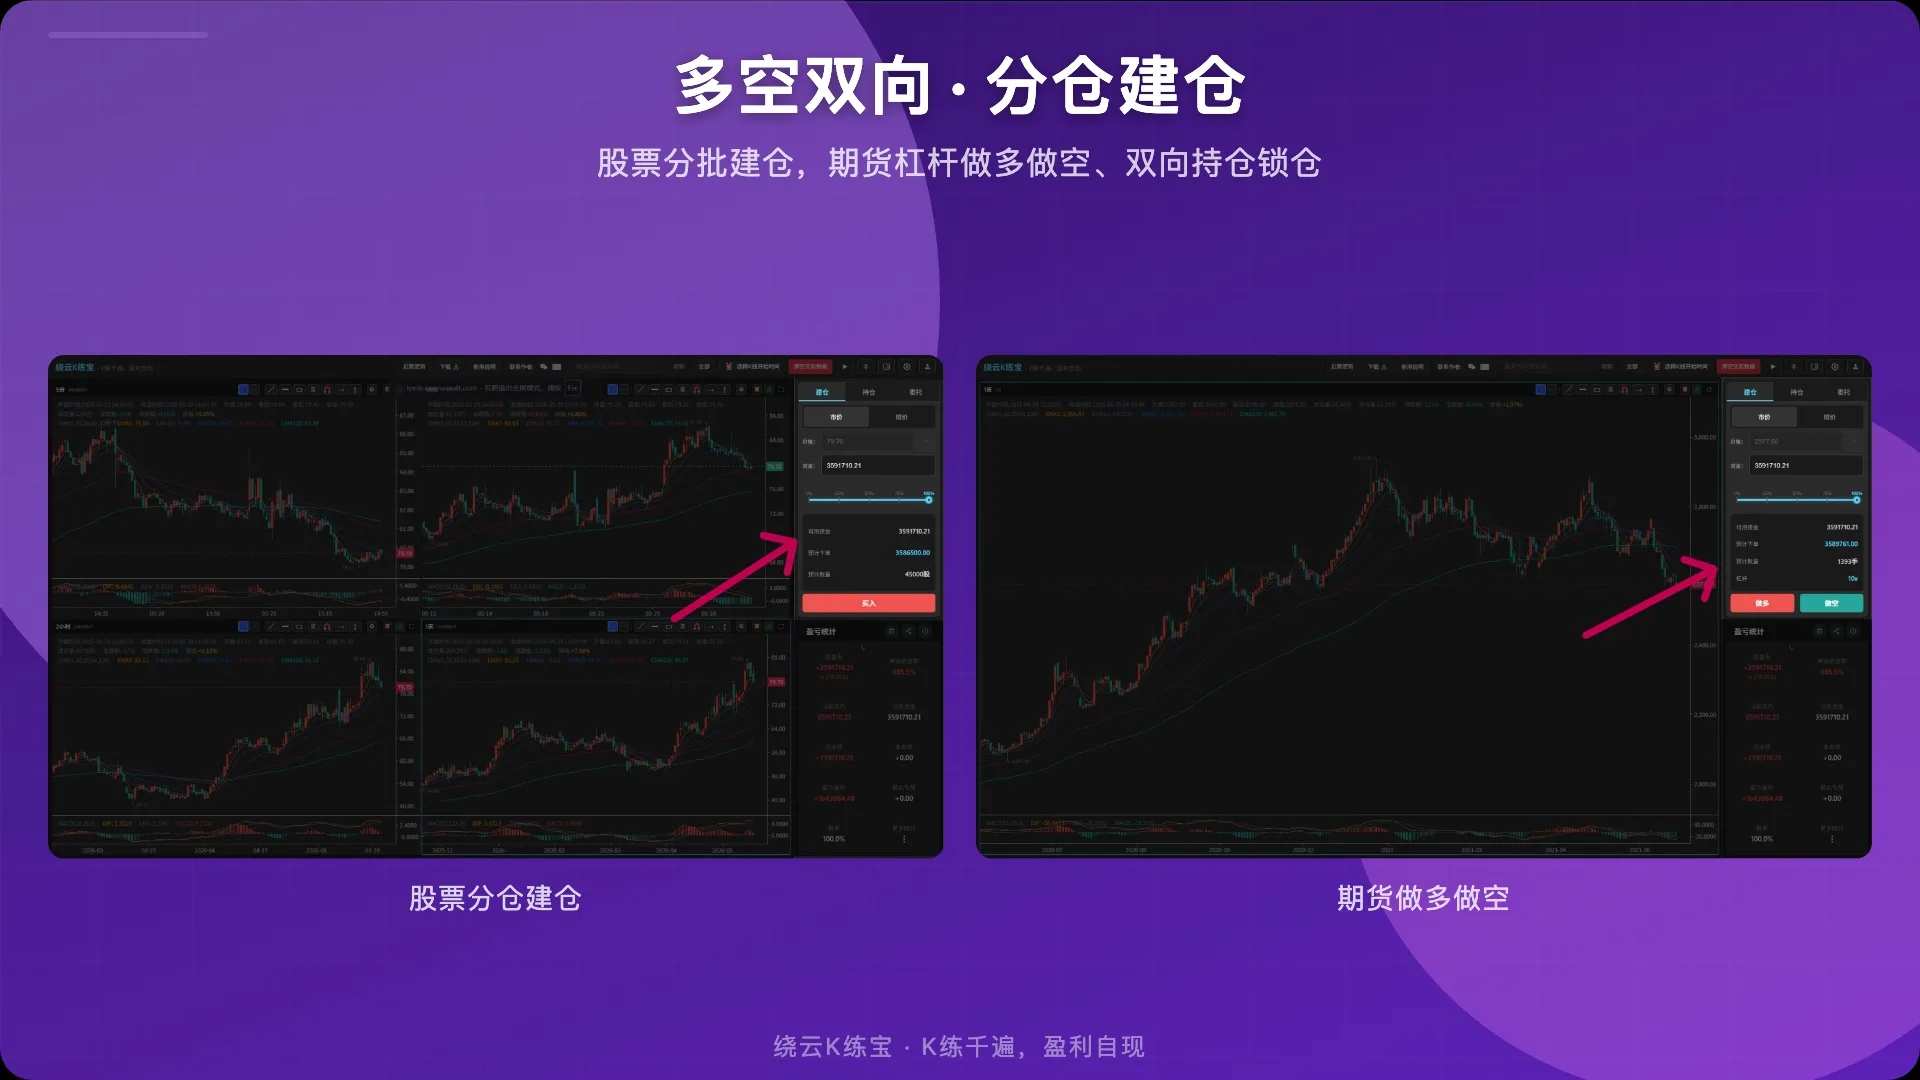
Simulate market & limit orders, scale in/out by percentage, with stop-loss and take-profit. Long stocks or trade futures both ways; same-side orders merge at weighted average and entries/exits auto-mark on the chart.
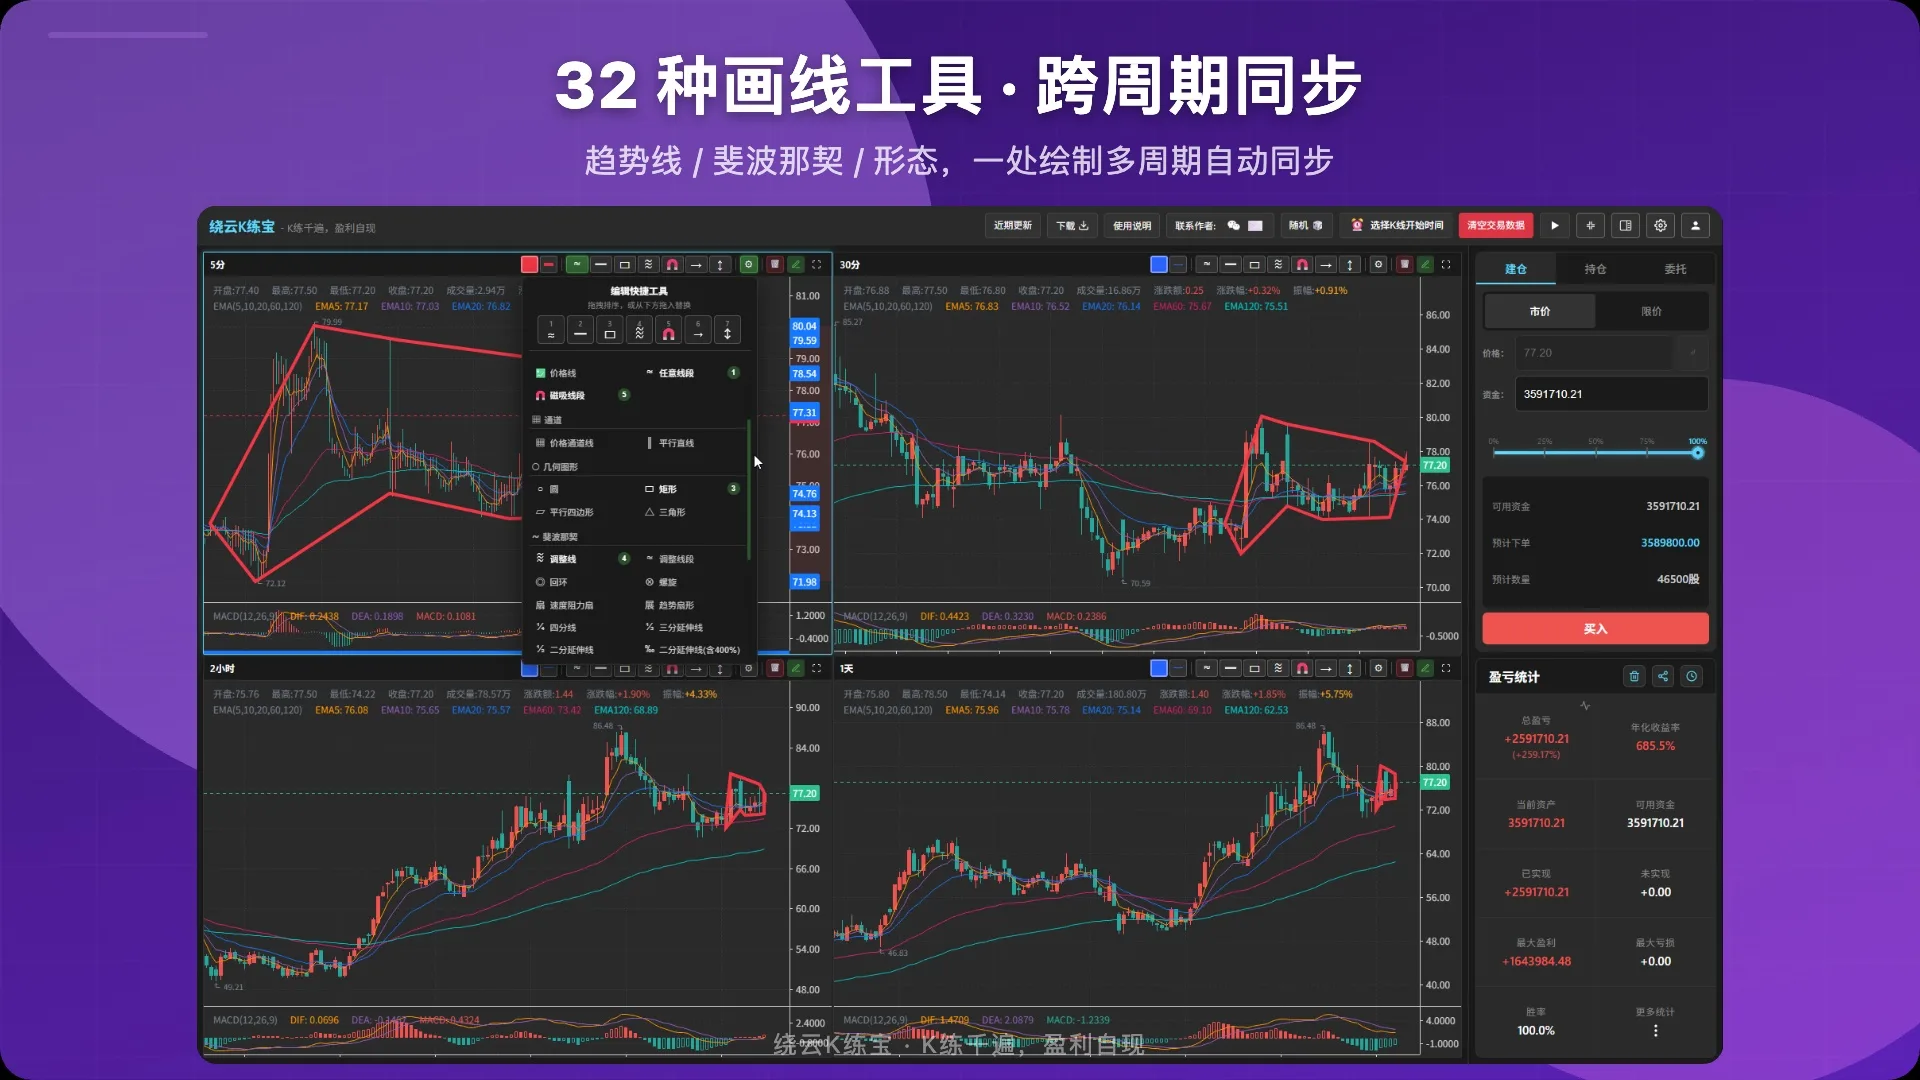
Trendlines, Fibonacci, Gann box, Elliott waves, XABCD patterns and 32 pro tools in all — with magnet snapping to highs/lows and cross-timeframe synced drawings.
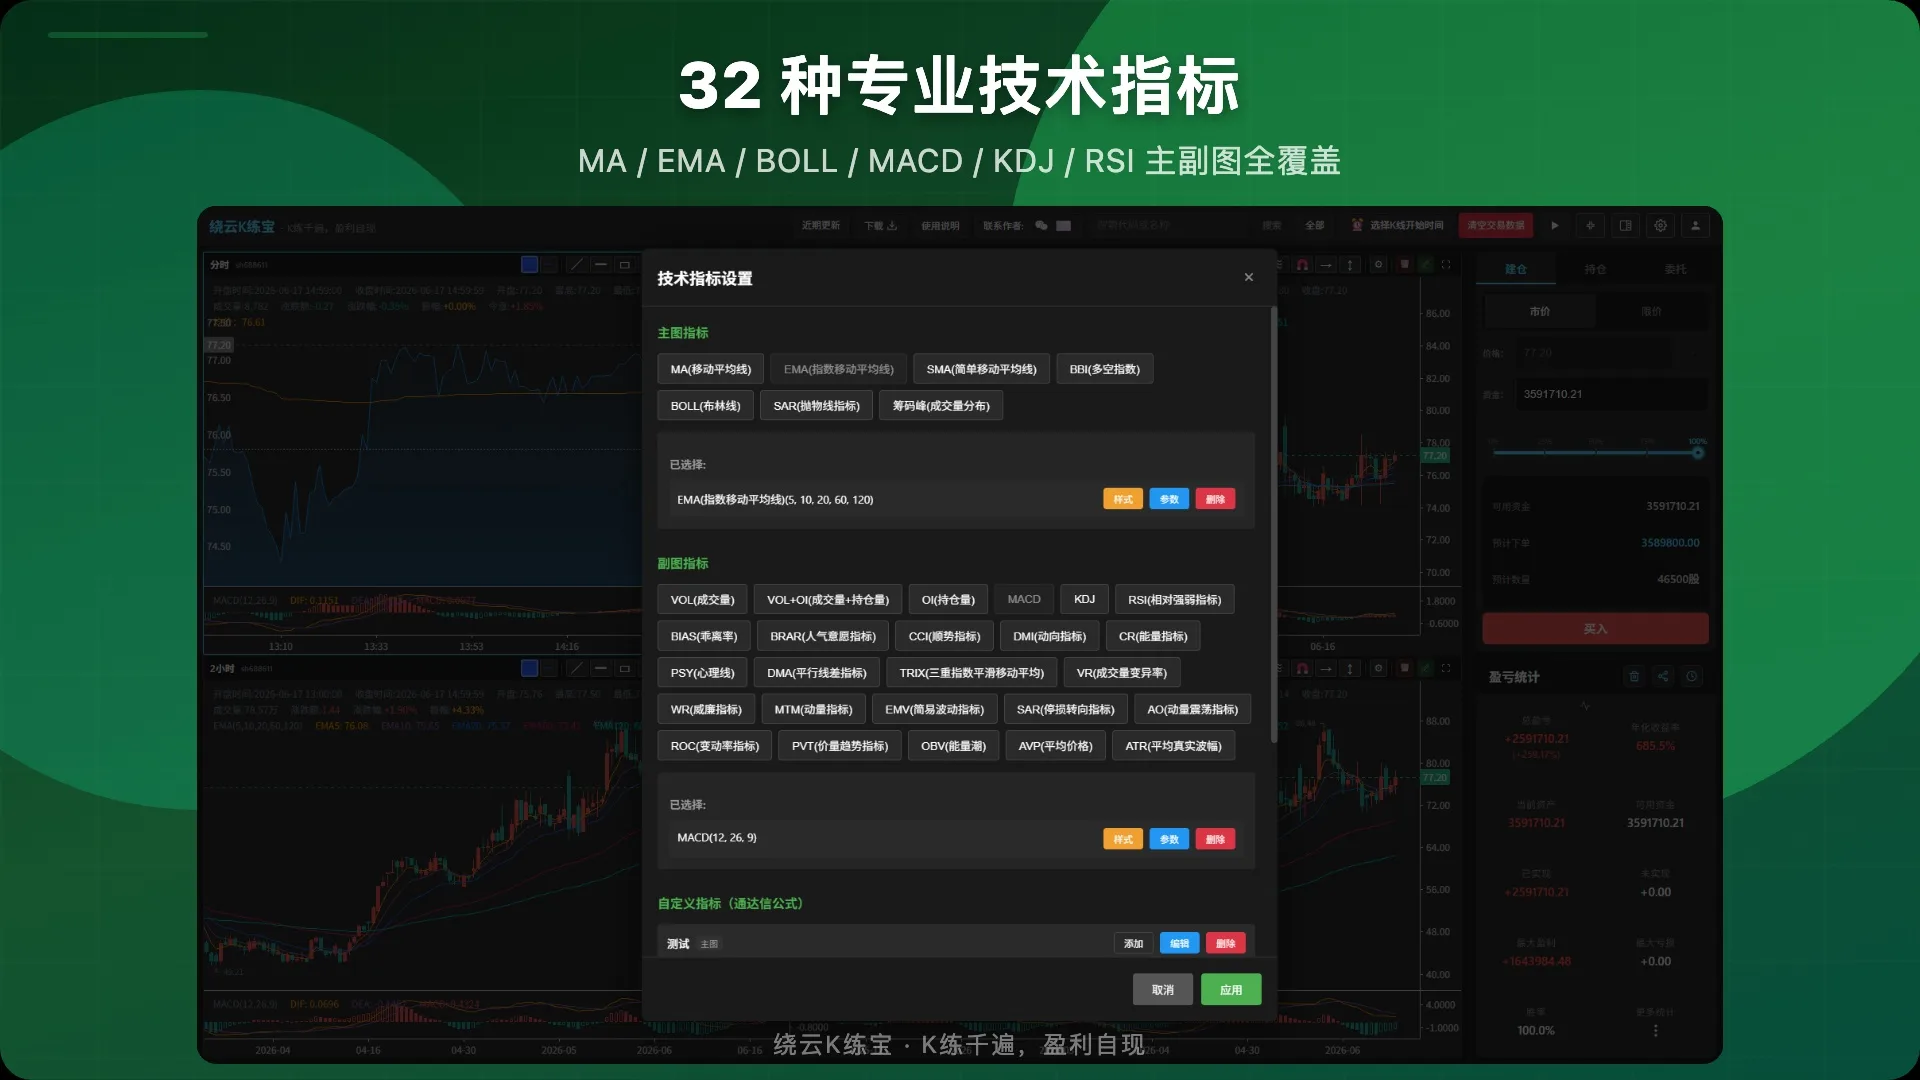
MA, MACD, KDJ, RSI, BOLL, ATR and 31 main/sub indicators, with fully customizable parameters and styles — including a futures-specific Volume+Open-Interest indicator.
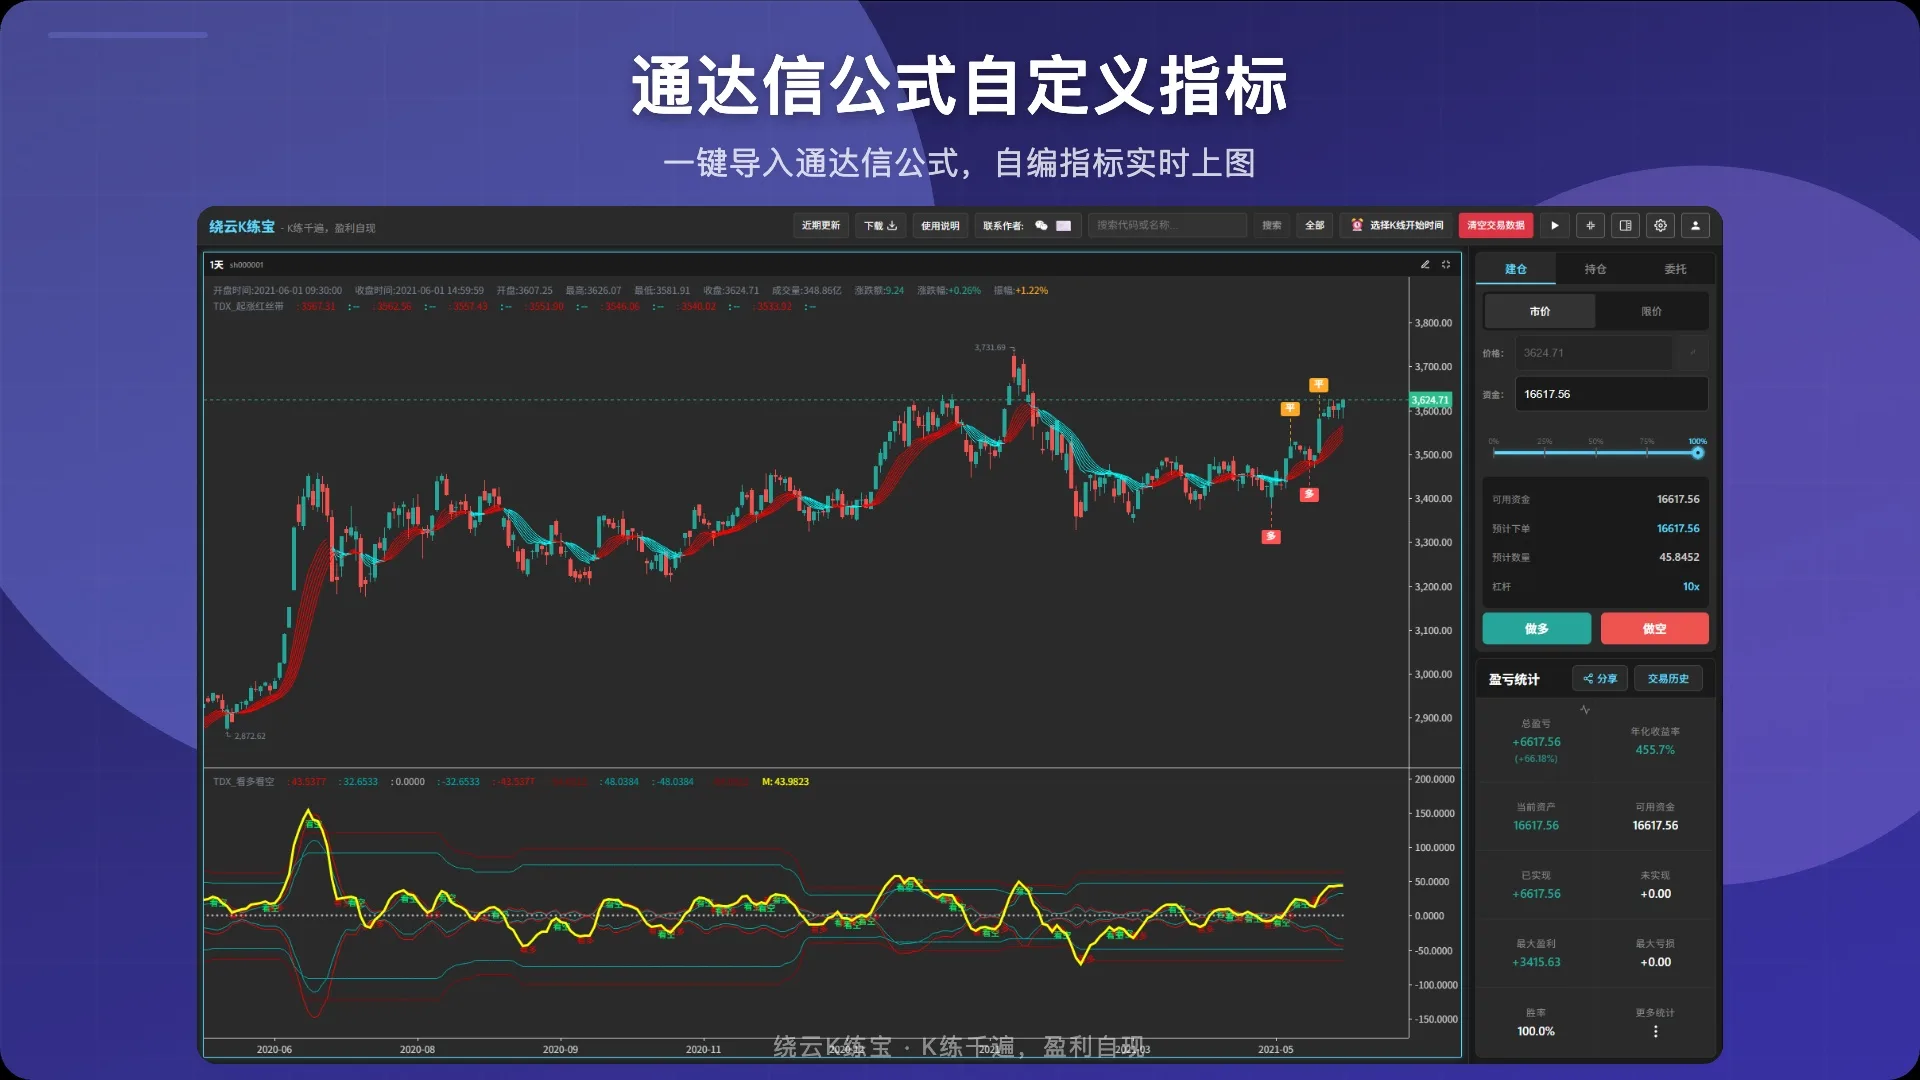
Compatible with TDX (Tongdaxin) formula syntax — write and import your own custom indicator formulas and bring your private indicators into the replay environment.
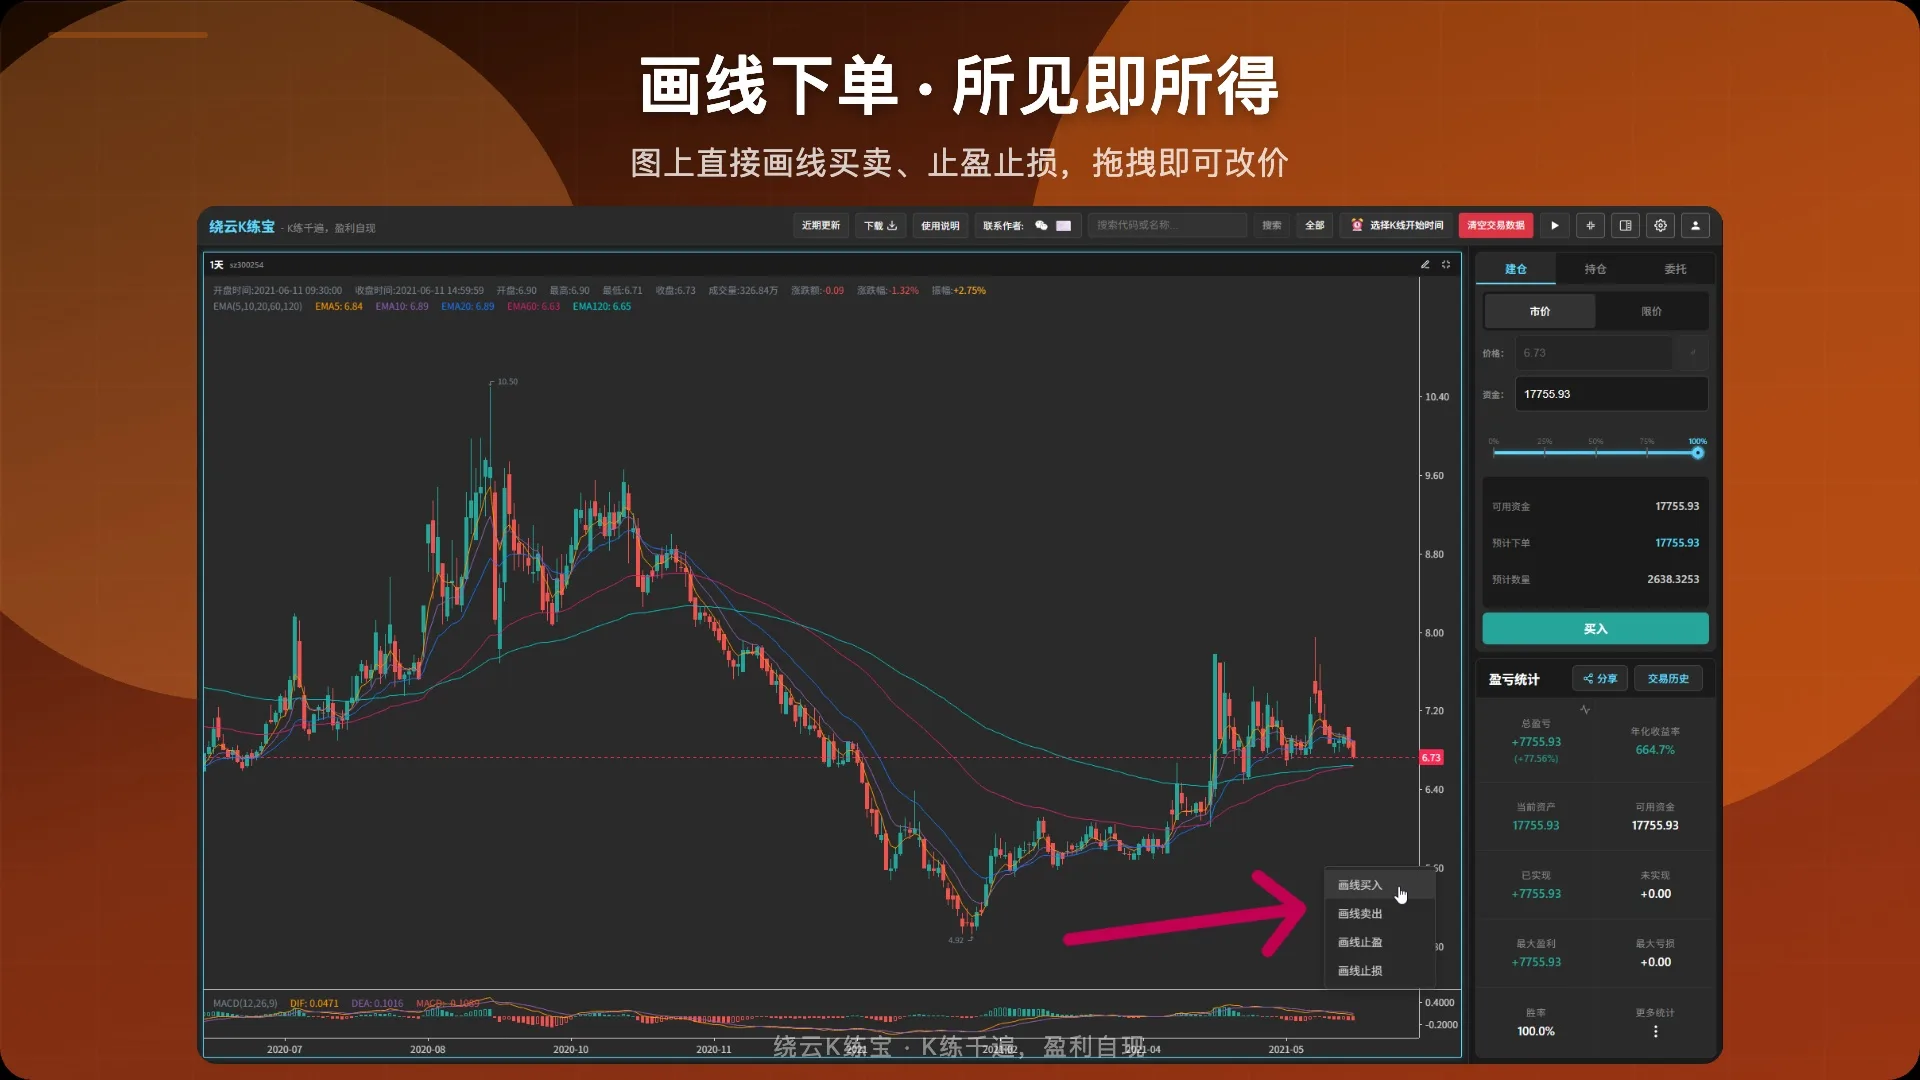
Drag a line on the chart to set a limit-order price. The line and the simulated order stay in sync in real time — what you see is what you get, dramatically speeding up order entry.
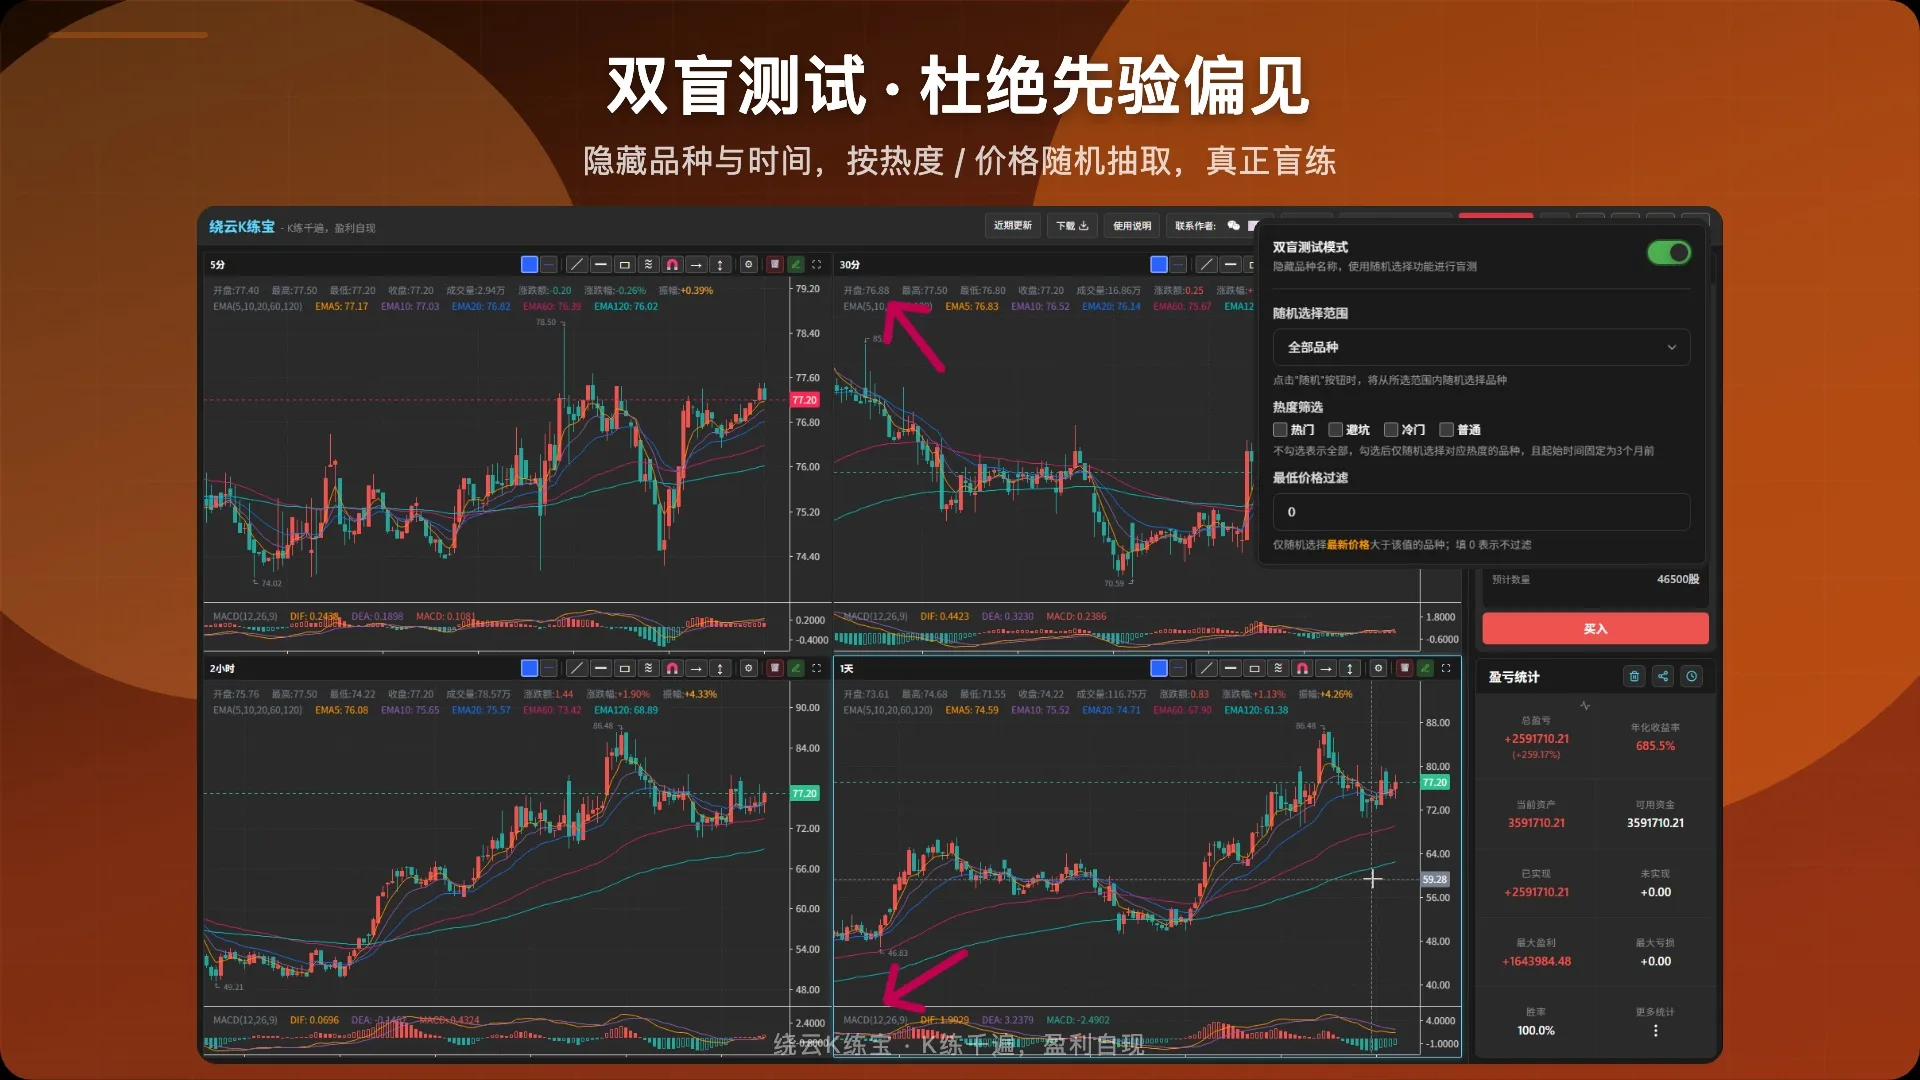
Hide the symbol name and date and replay a random instrument. Stripping away symbol bias and known outcomes forces you to read pure price action — the ultimate drill for raw instinct.
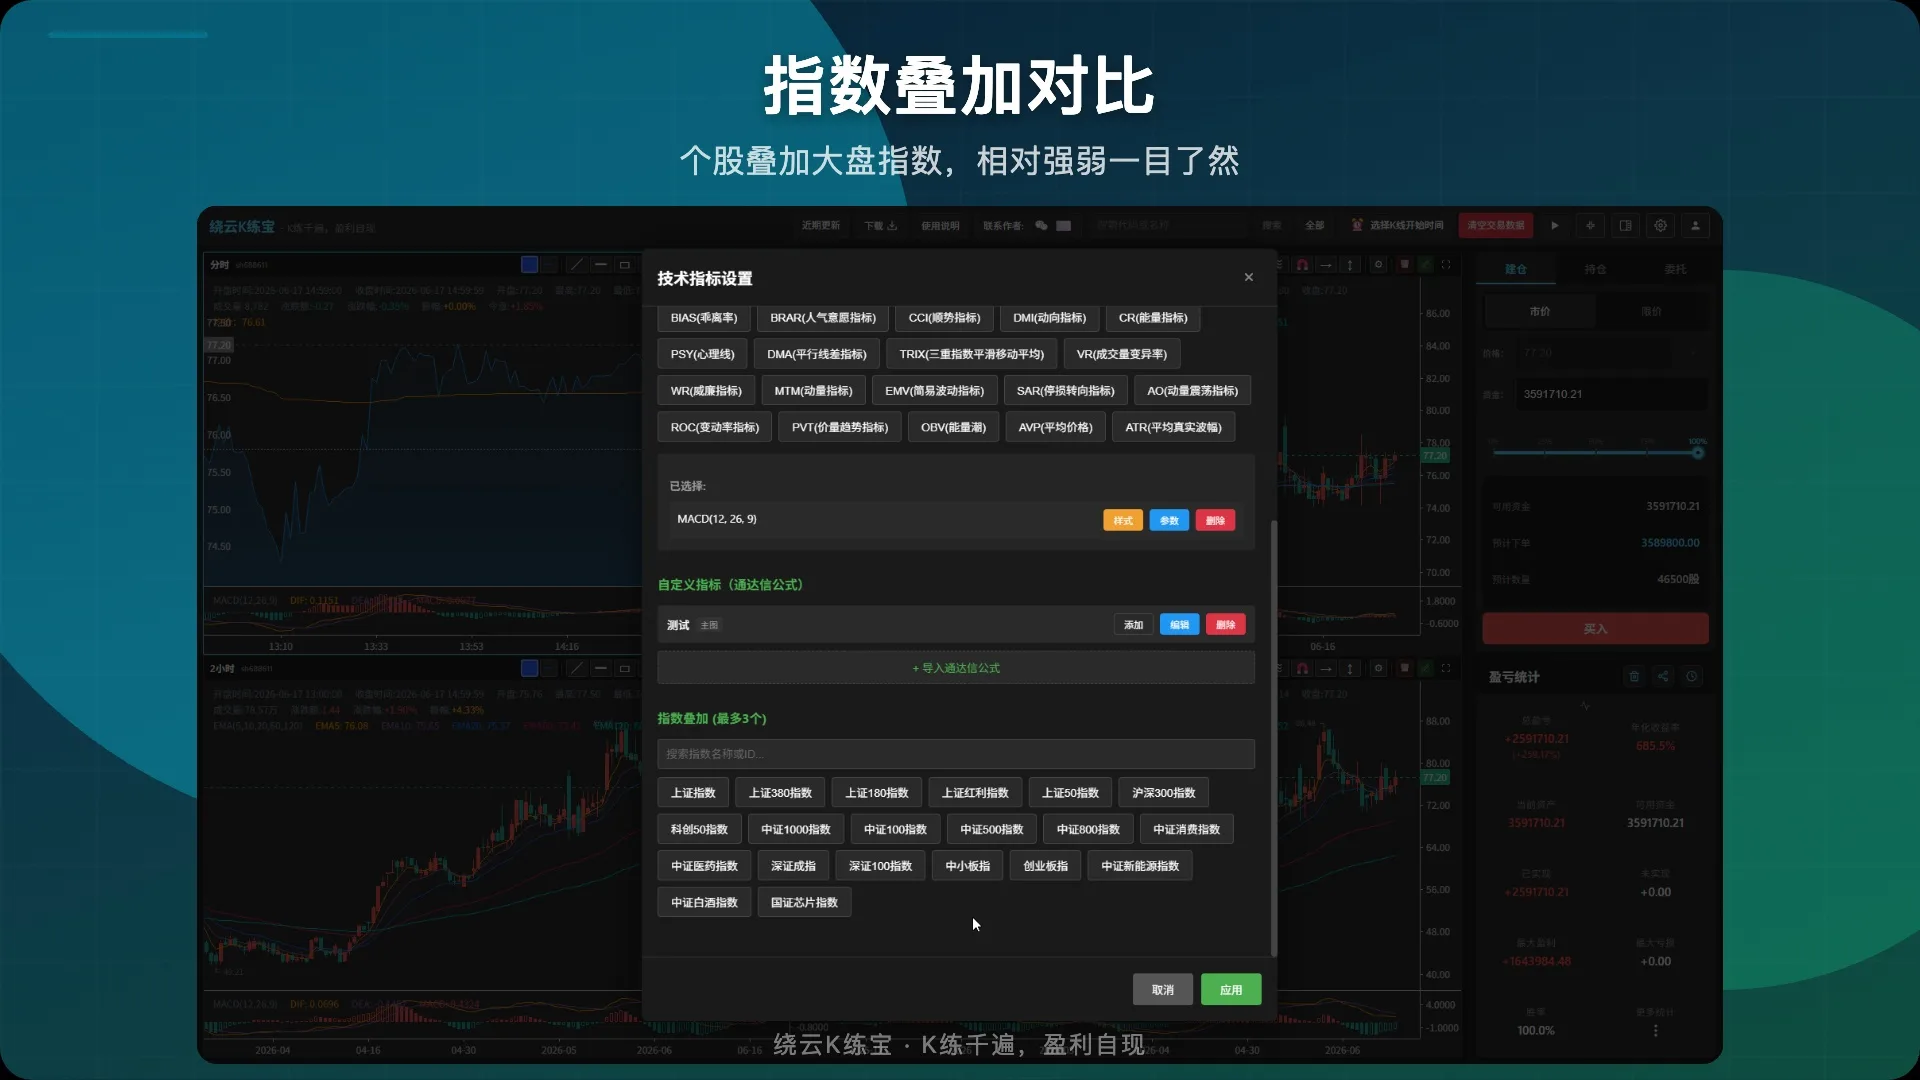
Overlay market indices onto the sub-chart (up to 3 at once) to compare a stock against the broad market and judge its relative strength.
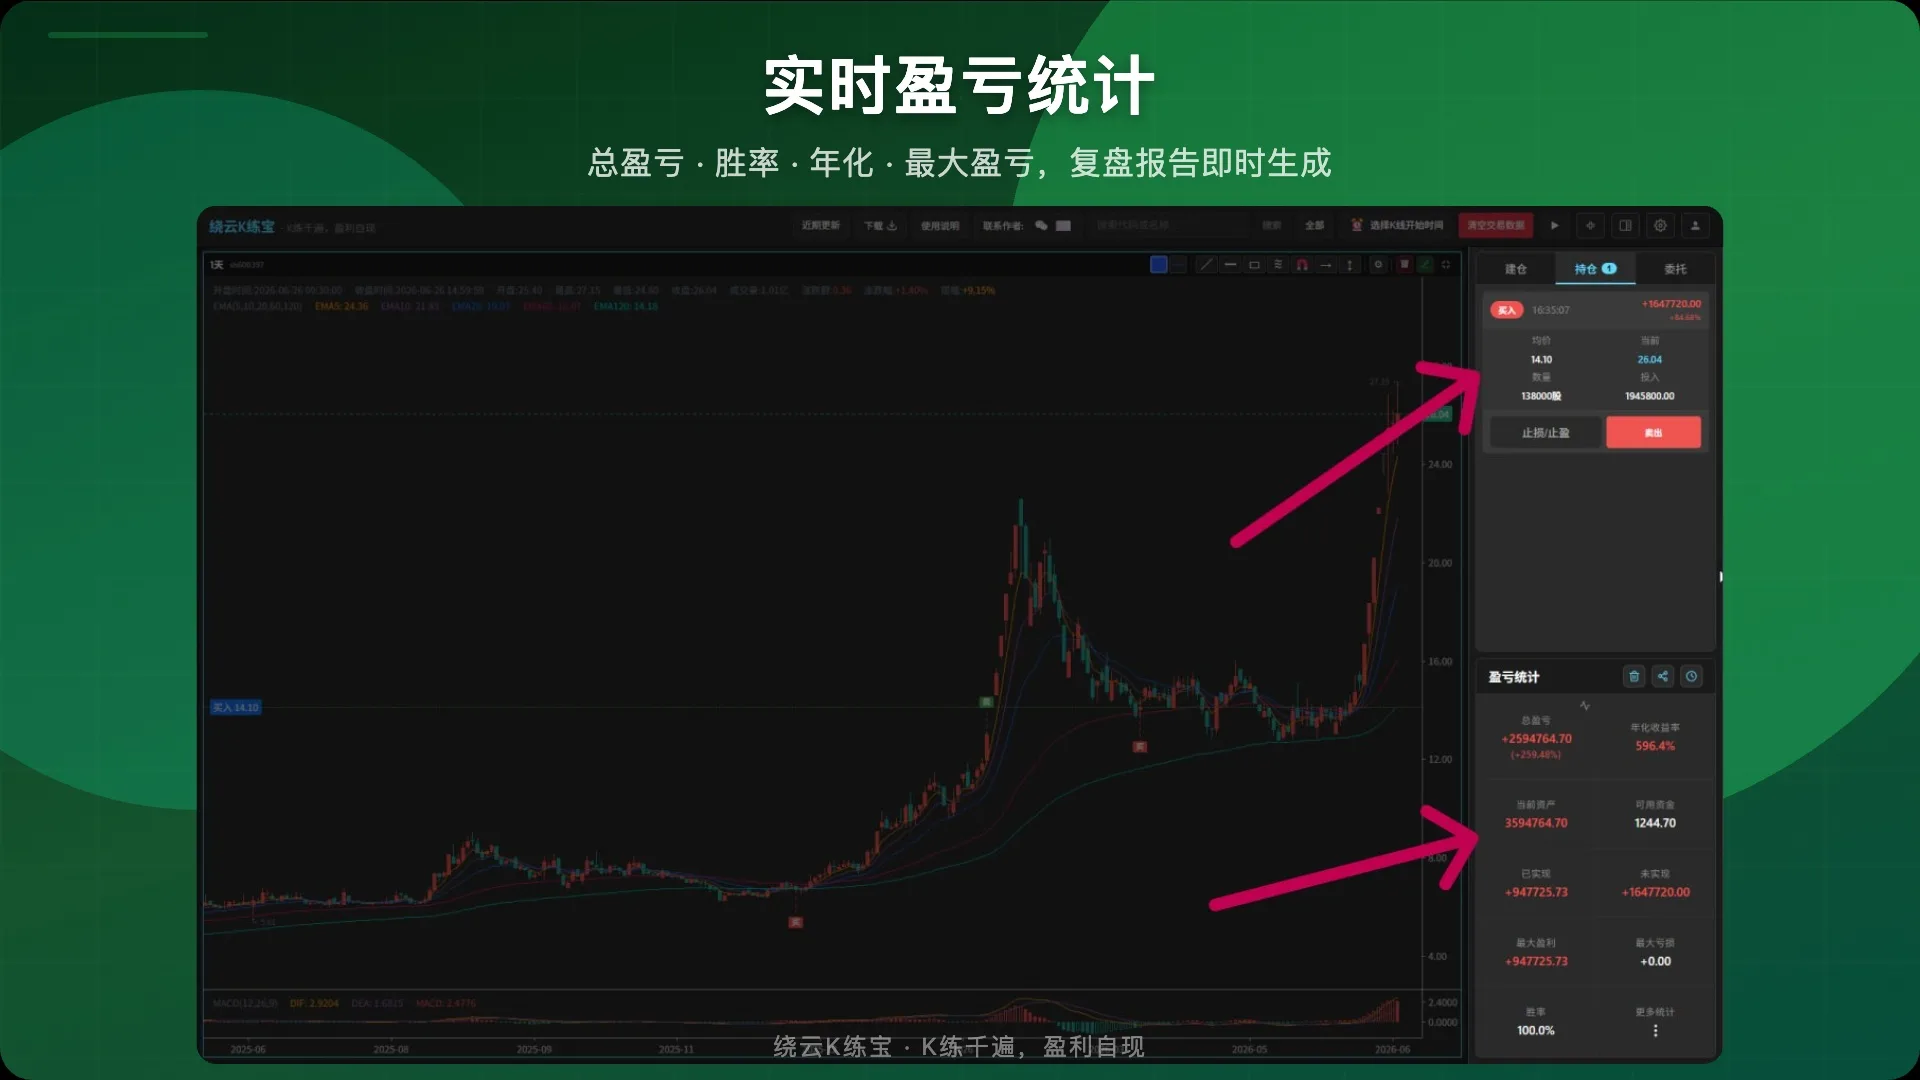
Automatically track win rate, cumulative return and max drawdown, and visualize account equity over time — quantify how effective your strategy really is.
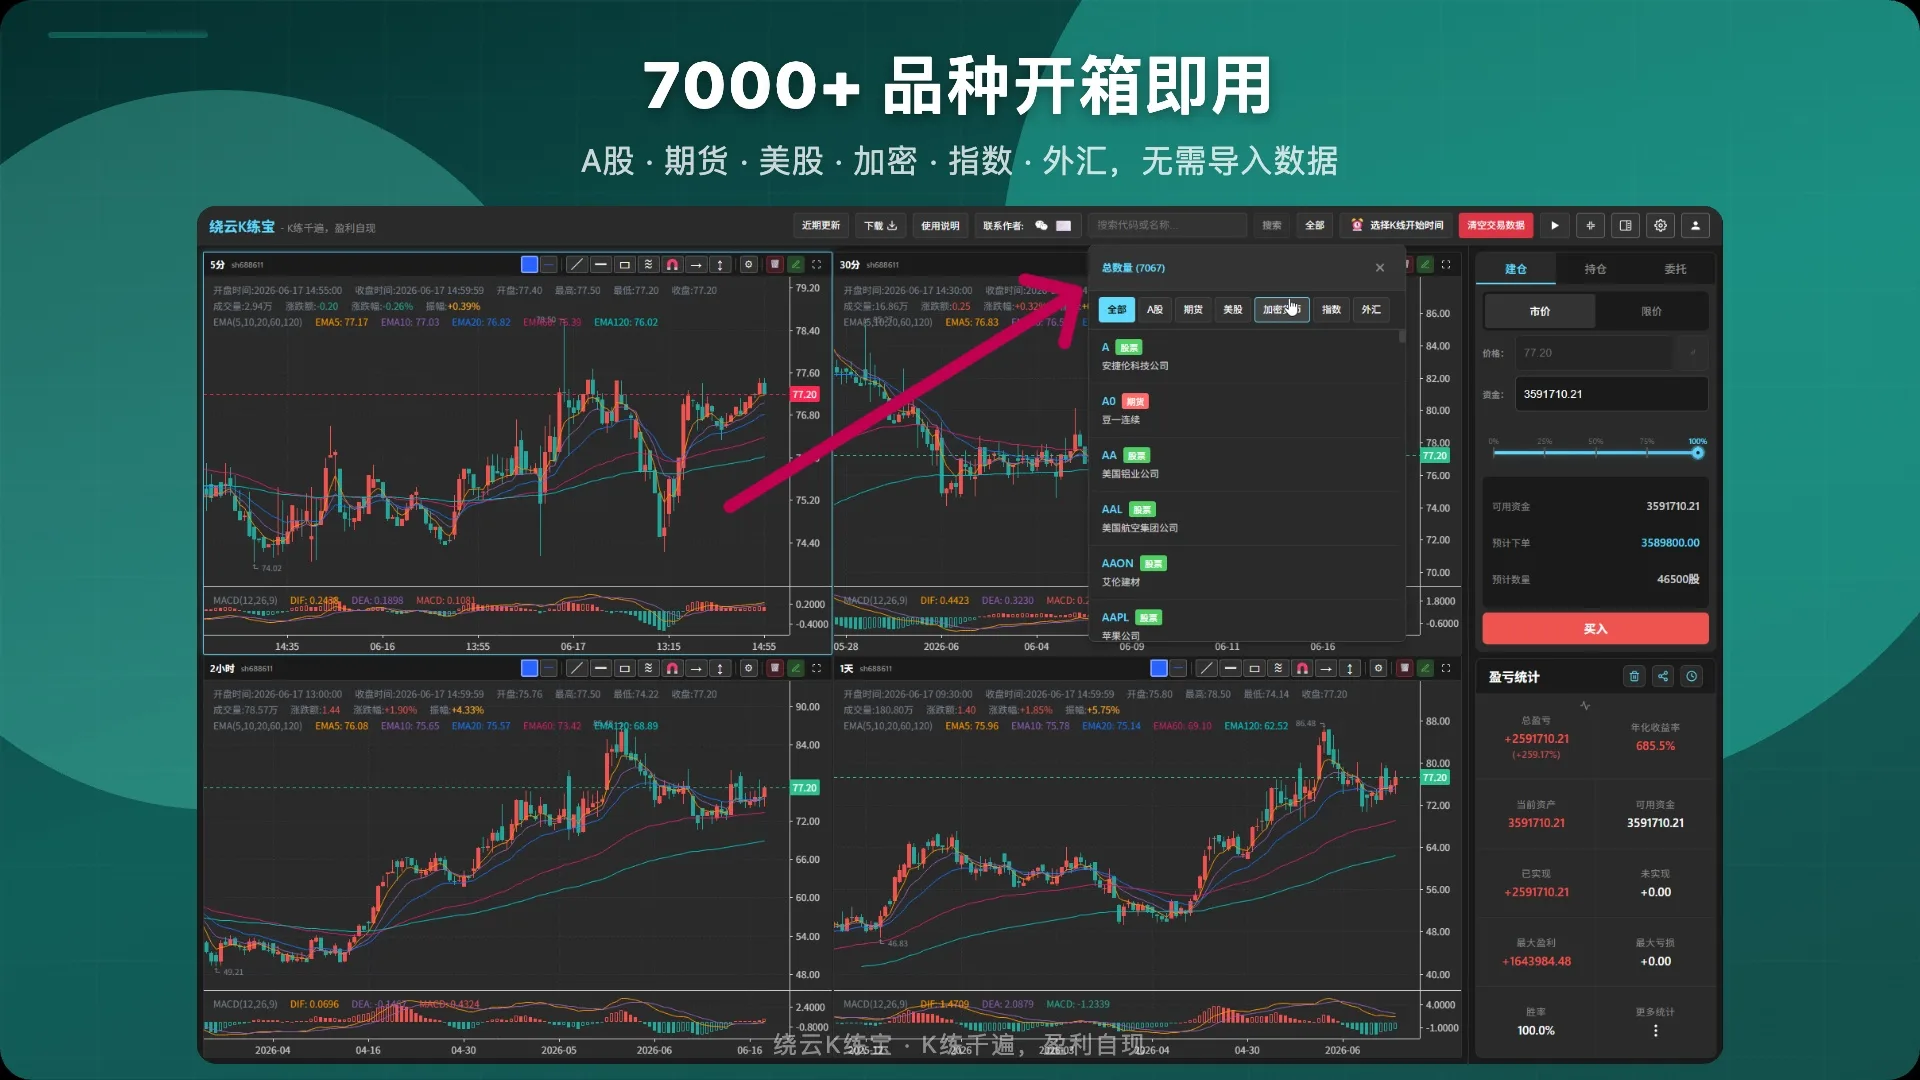
Covers 20000+ instruments across A-shares, ETFs/LOFs, convertible bonds, indices, futures, forex, US stocks and crypto. Online API data means selecting a symbol loads it instantly — no local database import required.
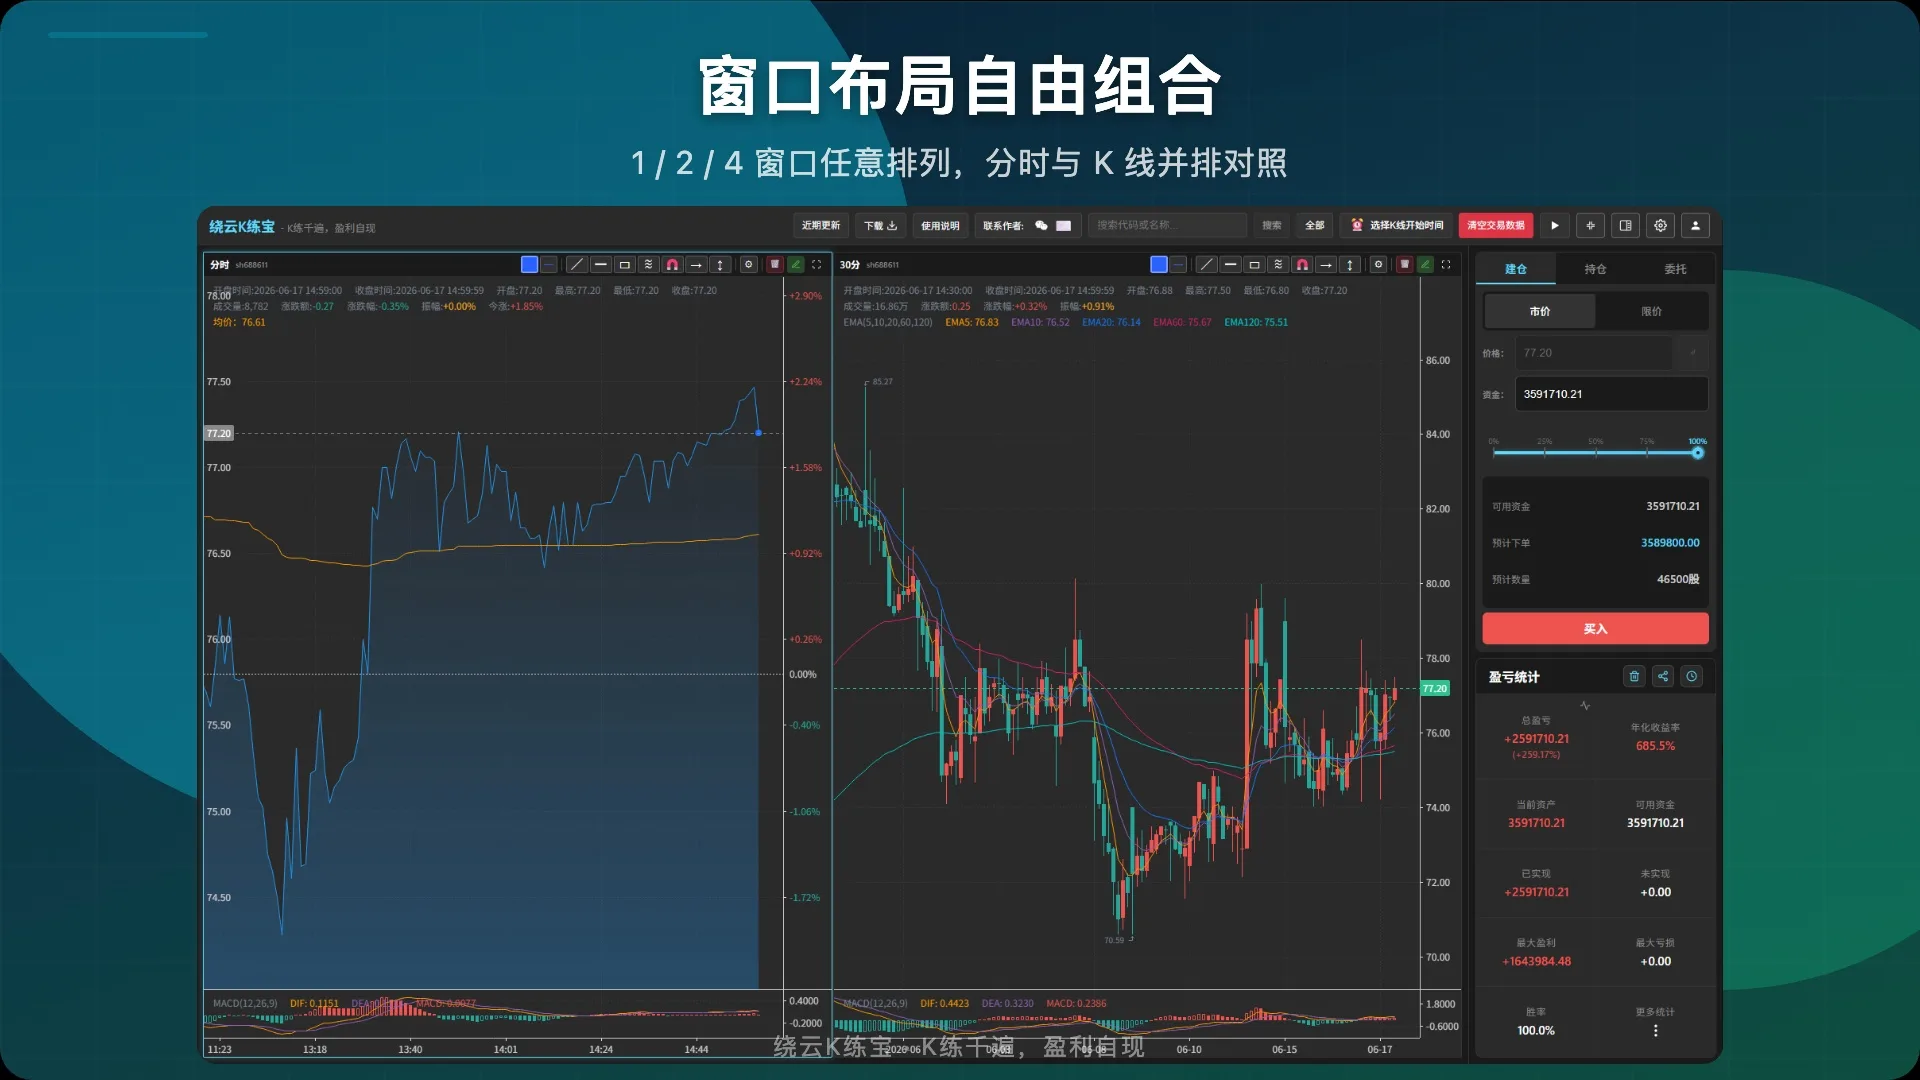
Choose four-window (2×2), dual-window (stacked/side-by-side) or single-window layouts, and map any timeframe to any pane — build the workspace that fits your analysis.
Ready out of the box, professional enough for the job
One account, six platforms — replay anywhere, anytime
From launch to first order in under a minute
Launch the web or desktop app and sign up to get started.
Search by code/name, or hit "Random" for a blind test.
History loads automatically — no local files to import.
Step through bars, place simulated orders, review and repeat.
The questions people ask most
No. Everything is simulated on historical data. It connects to no live system, involves no real money, and is for learning and replay practice only.
No. An online API data source covers 20000+ instruments across A-shares, US stocks, futures, forex, convertible bonds and more; pick a symbol and it loads automatically — ready out of the box.
Yes. Android and iOS apps plus a WeChat Mini Program are available, and the web version works in mobile browsers too. One account works across all six platforms.
It hides the symbol name and date and replays a random instrument, so you read pure price action without preconceptions — the core drill for building genuine instinct.
Practice makes the trader. Zero capital risk, anywhere, anytime.